Most of us are seeking happiness. Now more than ever, happiness has became one of the most pursued goals, and not just on individual level. Governments and companies in many countries are aiming to increase the happiness of their citizens and employees. Many scientists aim for simplifying happiness by measuring and quantifying it, resulting in headlines announcing: “Norway is the happiest country in the world”. These measurements surely tell us how countries have succeeded on many different levels, but can we be sure of the happiness of people in these nations? As anthropologists Izquierdo and Mathews (2009) argue, there is “no single pursuit for happiness”, as it varies greatly in societies and cultural contexts.
I started my journey as a happiness scholar looking right into these figures. Through regression analysis I found significant correlations between work values and happiness, which are elaborated in my book, Work For Your Happiness (Suojanen, 2012). Although significant, correlations didn’t really convince me. I wanted to understand better what people talk about when they talk about happiness. What does happiness mean to them? I wanted to make sense of happiness.
When measuring happiness, the most often asked question in surveys is: on scale 1-10, how happy are you? But what do these answers really tell us? My 7 might be your 9, and my 7 might refer to emotion in a particular moment, whereas your 9 to reflections on your satisfaction for life as a whole. As philosopher Daniel Haybro (2008) says: these answers not only fail to tell why these answers were selected, but they also fail in informing what people meant with the term ‘happy’.
This doesn’t mean that happiness studies using measurements, surveys and quantitative approach should be banned, but the information we gain from surveys is still rather limited, especially when talking about something as messy as happiness. As social anthropologist Neil Thin (2012) says: “quantitative studies can surely tell if the glass is half full, but they fail to tell what the glass contains and how the content was poured in”. Sociologist Mark Cieslik (2018) is concerned about surveys forcing happiness being seen as something people have, rather than something they do. According to Cieslik, surveys propose stagnant happiness, ignoring the process and the changes: happiness evolving and intertwining with structures and resources of individuals. Thin highlights that it is not just a matter of the inaccuracy or limitations with information based on numbers; this kind of data might also distort our efforts to focus on unimportant aspects of happiness, or might lead us away from sincerity and empathy and give too much emphasis on scores (e.g. Norwegians being the happiest). Therefore, qualitative studies are needed to complement and guide these measurements, and to allow us to hear the stories behind numbers. Also, as Thin (2009) emphasises, anthropologists “must make the comparative analytical and empirical study of wellbeing central to our concerns, to offer adequate descriptions of human experience”.
What is the right way to approach happiness as a human experience then? Can happiness ever be fully understood?
Interviews allow people to form their answers, and even lead the conversation, instead of choosing from given options. However, we are not all verbally talented, and talking about happiness could be a challenge to anyone, as it is so intangible. As we live in a very visual world and the current postmodern culture expands visual aspects to all parts of our lives, there are global trends towards greater dominance, or at least new forms, of visual information. Social philosopher Gillian Rose (2012) reminds that art, media, Facebook, and advertisements all render the world in visual terms. We are used to sharing our moments and lives constantly by taking photos and posting them on blogs, Facebook, Whatsapp, Instagram, and so forth. Also, as business academic Russell Belk (2017) says: “the current generation of ‘born digital’ consumers has come to expect visual images and quickly become bored with purely textual information”. Therefore, I started wondering if visual methods could provide an informative and fresh way to look into workplace happiness, as the use of visual data is still relatively rare in the organisational research.
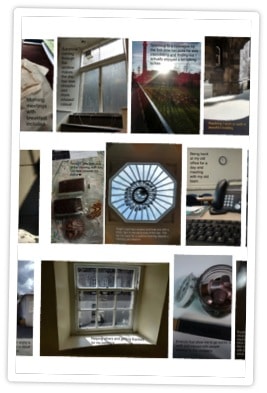
I asked 24 young professionals based in Scotland to take a photo whenever they experienced a work-related happiness moment during a two-week-period, as a part of my PhD study. They were requested to send the photo by using Whatsapp or email with a short explanatory caption. Later on, I printed out all the images and asked them to tell the stories behind the images. I call this method mindful photography, following Kurtz and Lyubomirsky’s (2013) work, but it is very similar, if not identical with other terms such as participant-led photography, participatory photography, and visual storytelling. These methods all support people to generate their own work and ask them to look at things from their own perspective. They are allowed to choose what kind of information they want to provide and what matters to them. It also invites them to share their lived experiences and naturally, allows for capturing the moment visually.
These photos, together with stories and discussions during semi-structured interview, provided a lot of information on happiness: the different ways people conceptualise happiness, the importance of and the expectations for happiness, enablers that either create or allow happiness, and insights into who is responsible for happiness. In addition to all this, I also learnt a great deal about visual methods.
The eight main benefits of using visual methods in happiness studies are (supported by the quotes form participants):
1) Taking and sending photos is a natural way to share information, as we are so used to taking photos and sharing them.
“I do take photos in my daily life, I use Instagram.” – Sofia, 27, business
2) Photos work as a great reminder to recall the moments later.
“I took pictures to remind me of what the moment was.” – Adam, 31, education
3) This method provides a fresh and instant way to look at happiness.
“There is certain immediacy to it that you don’t have in what we call diaries.” – Dennis, 28, education
4) It is a good attempt to capture a fleeting happiness moment.
“Happiness is quite complex idea and it means very different things to different people. I don’t think a very simplistic staff survey can address those things.” – Charlotte, 26, civil service
 5) Participants have the ownership of the photos. They were and still are their photos, which they chose to share.
6) This provides a new way to interview. Participants were able to focus on something else than interviewer’s face, which made the situation more relaxed and helped to focus on the topic. They lead the conversations and were able to bring up topics that mattered to them. Also, as the pictures were put together as a collage, this method allowed them to look at the bigger picture and to reflect on their happiness on another level.
7) The images also provided information of the participants’ surroundings and environments, allowing access to many workplaces.
8) It makes research more interesting, pleasant, and informative for the researcher, participant, and the reader, and also perhaps increases happiness.
“It wasn’t just a little thing to stop for 10 seconds, it actually made me happy. I enjoyed taking the photos and it made me to stop and think, which I don’t normally do.” – Charlie, 30, retail
There were also challenges both during the data collection and analysis. These challenges should not stop anyone from using visual methods, but instead to encourage them to look for ways to conquer obstacles and improve the methodology.
1) There were moments when participants were not able to take a photo. There were several reasons for this: cameras were not allowed, full concentration was needed, it was seen as nonprofessional behaviour, confidentiality and anonymity were at risk, or participation was forgotten.
2) Sometimes it was hard to recognise or choose a happiness moment to report:
“What I found difficult about this was judging when happiness is worth recording.”- Jack, 36, education
3) Some participants questioned if it is even possible to take pictures of happiness, a highly internal feeling not necessary related to anything external around to capture in a photo:
“For example, having a good conversation. Or working in a company that values what you value; you cannot take a picture of it. “ – Nathan, 24, banking
4) In some occasions it could be questioned if the happiness moment was an authentic one or an attempt to please the researcher and to complete a promised task:
“Most of them I was trying to push. If I had not received your messages I would have not sent anything, because it was really difficult to find something.” – Miguel, 34, oceanography
5) The timing of the study in spring and summer very likely increased the amount of sunny outdoor images. Also the tasks differed in some cases around the year.
“I would have taken very different pictures had this been during semester time, there would have been more pics about teaching.”- Dennis, 28, education
 As I started analysing the data, I realised there were differences between the results based solely on photos and those based on narratives. For example, had happiness been analysed purely based on the images, the main conclusions would have been based on 19 photos of mugs and 28 photos of blue skies and sun, and barely any pictures of people: warm beverages and nice weather make people happy at work, other people have no influence on happiness. In contrast, analysis based on narratives gave somewhat varying results; although nature and weather were among the five main generators of happiness moments, coffee wasn’t. As the participants were highly aware of not taking photos of people for various reasons, there were barely any images of people, although many of the narratives focused on the interactions with others.
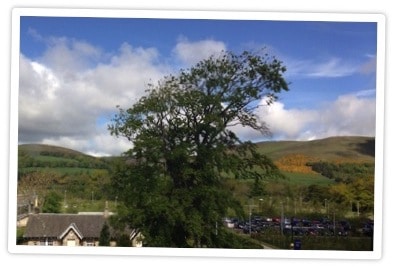 Also, although entries did include plenty of nature related photos, some of the happy moments were not related to nature as such, but were taken on the way home after a successful day at work or after a pleasant train journey with colleagues, in which case happiness was not caused by weather or nature. Images of warm beverages were shared with narratives of pleasant conversations with colleagues, quiet breaks during a hectic day or the flexibility of the work. The photos were not necessarily always representing a happiness moment and were occasionally even misinformative. I want to highlight that this is possible indeed with numbers and words as well. According to Sam Warren (2002), photos can provide only a fragmented and partial reality, and therefore words are needed to “synthetise images and text as a whole”.
Therefore, I found the combination of photos and narratives most suitable to make sense of the happiness experiences, as I believe, just like Warren, that although the words and images are not sufficient alone, they can “create a synergy” together.
Coming back to my earlier question: “can happiness be fully understood?” Maybe not, and that is part of the charm. We can aim to understand it in variety and richness – how it is expressed and experienced by each individual – in which an anthropological approach can provide plenty of possibilities, mindful photography just being one. I welcome the challenge to provide more information on something as mobile, context dependent, ambivalent, subjective, and intangible as happiness.
References:
Belk, R. (2017) Collaborating in visual consumer research, In Maryann McCabe (ed.) Collaborative Ethnography in Business Environments, London and NewYork: Routledge.
Cieslik, M. 2018. Sociology, biographical research and the development of critical happiness studies, in S. Brinkmann, A. Patersen and N. Hill (eds.) Critical happiness studies. London: Routledge. In press.
Haybron, D. M. (2008). The Pursuit of Unhappiness: The Elusive Psychology of Well-Being. New York: Oxford University Press.
Izquierdo, C. & Mathews, G. 2009. Pursuits of happiness well-being in anthropological perspective, NY: Berghahn Books.
Kurtz, J. & Lyubomirsky, S. 2013. Happiness promotion, using mindful photography to increase positive emiotion and appreciation, In Froh, J. & Parks, A (eds.) Activities for teahching positive psychology: A guide for instructors, pp. 133-136, Washington: American Psychological Association.
Rose, G. 2012. Visual methodologies, An introduction to researching with visual materials, London: SAGE.
Suojanen, I. (2012) Work for your happiness. CreateSpace.
Thin, N. (2012). Counting and recounting happiness and culture: On happiness
surveys and prudential ethnobiography. International Journal of Wellbeing, 2, 313–332.
Thin, N. 2009. Why anthropology can ill afford to ignore well-being. In Pursuits of happiness.
Warren, S. (2002). “ Show Me How it Feels to Work Here”: Using Photography to Research Organizational Aesthetics. Ephemera, 2(3), 224–245.
All photos courtesy of Ilona Suojanen.
This post was first published on 30 May 2017.